
Rate of photosynthesis and limiting factorsSpec B6.1.7
In short
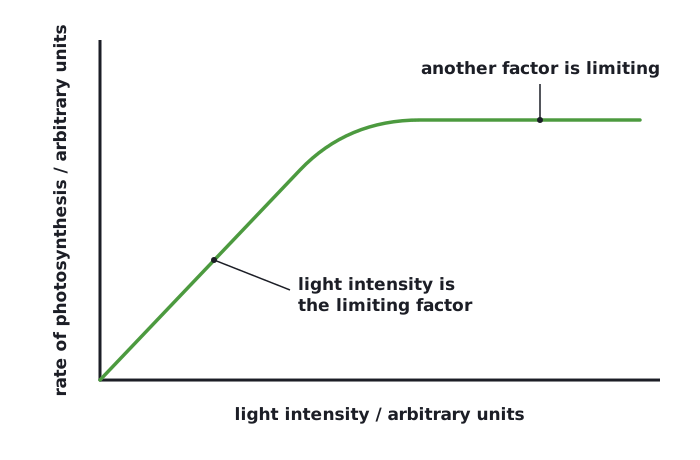
A limiting factor is the factor in shortest supply, which stops the rate of photosynthesis from increasing. Light intensity, carbon dioxide concentration and temperature can each be limiting. Increasing a limiting factor raises the rate; increasing a factor that is not limiting makes no difference. On a graph, the factor is limiting where the line is still rising.
A limiting factor is the factor that is in shortest supply, so it stops the rate of photosynthesis from increasing. Increasing a limiting factor increases the rate. Increasing a factor that is not limiting makes no difference.
| Factor | Why it limits the rate | Shape of the graph |
|---|---|---|
| Light intensity | Light provides the energy for photosynthesis. In dim light there is too little energy. | Rate rises as light intensity rises, then levels off |
| Carbon dioxide concentration | Carbon dioxide is a raw material. At low concentration there is too little to use. | Rate rises as concentration rises, then levels off |
| Temperature | Photosynthesis is controlled by enzymes. A higher temperature gives faster molecular movement and more collisions, but above the optimum the enzymes are denatured. | Rate rises to an optimum, then falls sharply |
 (opens full size in a new tab)
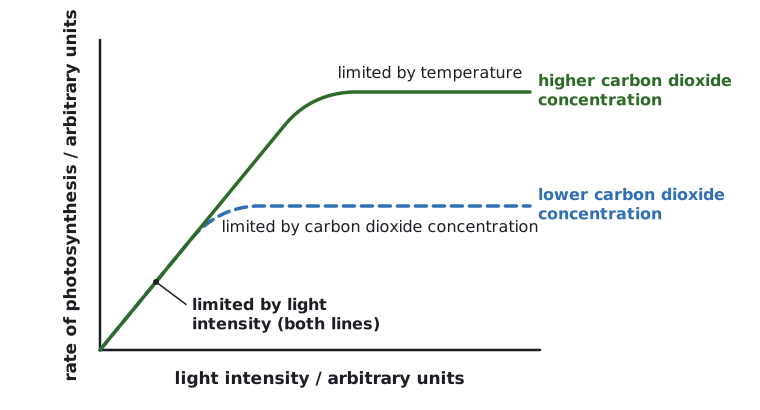
Where the line is still rising, the factor on the x-axis is limiting. Where the line is flat, a different factor is limiting. With two lines, the factor in shortest supply sets the height of the plateau.
 (opens full size in a new tab)
Limiting factors in different environments
| Environment | Likely limiting factor | Explanation |
|---|---|---|
| Bright summer midday | Carbon dioxide concentration or temperature | Light is plentiful. Carbon dioxide is only a small fraction of the air, and enzymes may be too hot or too cool. |
| Dull winter morning | Light intensity and temperature | Little light energy is available and low temperature slows enzyme activity. |
| At night | Light intensity | No light energy, so photosynthesis cannot happen. |
| Floor of a dense woodland | Light intensity | Leaves above absorb most of the light. |
| Cold bright day | Temperature | Light and carbon dioxide are available, but enzymes work slowly in the cold. |
To identify the limiting factor, ask which factor would raise the rate if it were increased. In an explanation, name the factor, say it is in short supply, and link it to the process (light is the energy source, carbon dioxide is a raw material, temperature affects the enzymes).
Do not say enzymes are 'killed' by high temperature. They are denatured.
Written and checked against the Cambridge IGCSE Combined Science (0653) specification · Updated October 2026