
Handling data about diseaseSpec 4.2.2.5
In short
Disease incidence is how often a disease occurs in a population. You should be able to move it between numbers and graphs using frequency tables, bar charts, histograms and scatter diagrams, which can show a correlation. Data come from a sample, and a larger sample that is representative of the population gives more reliable data.
You need to be able to translate disease incidence information between graphical and numerical forms. Incidence is how often a disease occurs in a population.
- Construct and interpret frequency tables and diagrams.
- Use bar charts for data in separate categories, and histograms for continuous data grouped into ranges.
- Use a scatter diagram to identify a correlation between two variables. A positive correlation means one variable increases as the other increases. A negative correlation means one decreases as the other increases. No pattern means no correlation.
Sampling
It is not possible to test everyone, so scientists collect data from a sample. In epidemiological studies, a larger sample that is representative of the population gives more reliable data.
Disease incidence
In a town of 40 000 people, 60 new cases of a disease were recorded in one year. Calculate the number of new cases per 100 000 people.
- Divide the number of cases by the population: 60 ÷ 40 000 = 0.0015.
- Multiply by 100 000.
Answer: 150 cases per 100 000 people
Comparing places of different size is only fair if you use the number of cases per 100 000 (or another equal number of people), not the raw number of cases. The numbers in this example are for practice only.
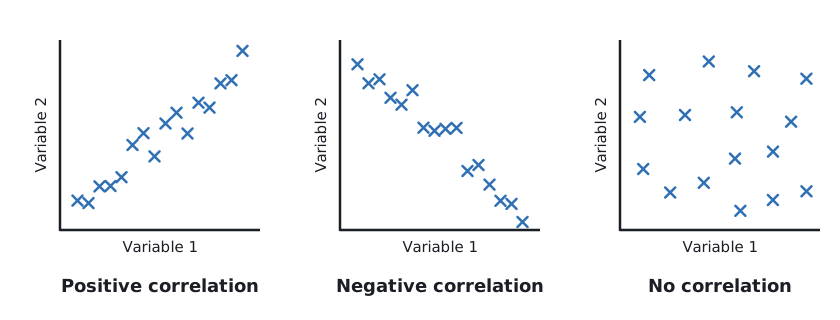 (opens full size in a new tab)
Written and checked against the AQA GCSE Combined Science (8464) specification · Updated October 2026