
Abiotic and biotic factorsSpec 9.2
In short
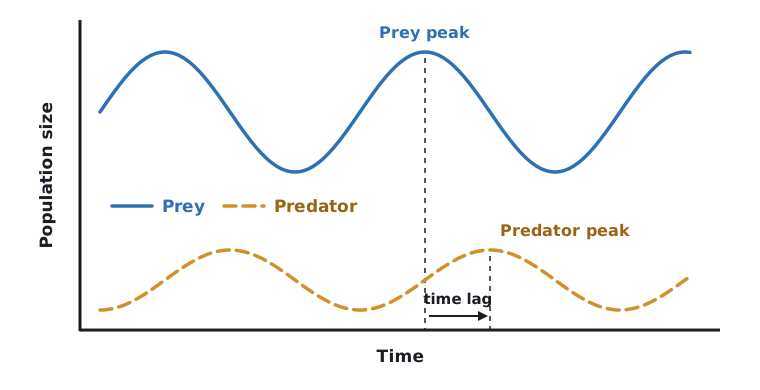
Abiotic factors are the non-living factors that affect a community, such as temperature, light, water and pollutants. Biotic factors are the living factors, such as competition and predation. Changes in either can change which species live in a community and how many there are. On a predator-prey graph, the predator peak comes after the prey peak.
The organisms in a community are affected by abiotic factors (non-living) and biotic factors (living). Changes in either can change which species live in a community and how many there are.
| Type | Factor | How it can affect a community |
|---|---|---|
| Abiotic | Temperature | Affects the rate of enzyme-controlled reactions, so growth and survival. Species survive only within a range of temperatures. |
| Abiotic | Light | Plants need light for photosynthesis. Less light means fewer plants, and so less food for the animals that depend on them. |
| Abiotic | Water | All organisms need water. In dry conditions only organisms adapted to save water survive, so numbers and variety fall. |
| Abiotic | Pollutants | Pollutants such as sulfur dioxide in air or sewage in water can kill sensitive species, reducing the variety of organisms. |
| Biotic | Competition | Organisms of the same or different species compete for the same limited resources, such as food, water, light and space. |
| Biotic | Predation | Predators eat prey, so predator and prey numbers affect each other. |
Competition
Competition happens when organisms need the same resource and there is not enough for all of them. Plants compete for light, water and mineral ions. Animals compete for food, water and territory. The better-adapted species gets more of the resource, so it survives and reproduces more, and the numbers of the other species may fall.
Predation
In a stable community, predator and prey numbers rise and fall in a repeating pattern. When prey numbers rise, predators have more food, so predator numbers rise. More predators eat more prey, so prey numbers fall. With less food, predator numbers then fall, and the prey can recover.
On a predator-prey graph, the predator peak comes after the prey peak, because predator numbers rise only once there is more food.
 (opens full size in a new tab)
Written and checked against the Edexcel GCSE Combined Science (1SC0) specification · Updated October 2026