
Book a tutor

Pyramids of biomass

Ecology · Trophic levels in an ecosystem · note 2 of 3

Spec 4.7.4.2
Triple only (what this means)Triple only: only in Triple Biology. Combined Science students can skip it. What the labels mean
Download all Trophic levels in an ecosystem notes (PDF)Download all notes (PDF)4 pages

Pyramids of biomassSpec 4.7.4.2

In short

A pyramid of biomass represents the relative amount of biomass in each trophic level of a food chain. Trophic level 1, the producers, is at the bottom. Each bar is narrower than the one below it, because biomass decreases at each higher trophic level. To draw one, make each bar's length proportional to its biomass and centre the bars.

Pyramids of biomass can be constructed to represent the relative amount of biomass in each level of a food chain. Trophic level 1 is at the bottom of the pyramid.

Each bar is narrower than the one below it, because the biomass decreases at each higher trophic level. This gives the pyramid shape.

  1. Draw horizontal bars, one for each trophic level, with trophic level 1 at the bottom.
  2. Choose a scale so that the length of each bar is proportional to the biomass of that level.
  3. Centre the bars on a vertical line and label each bar with the organism or level.

Constructing a pyramid

A food chain has biomass of 400 g per m² of grass, 40 g per m² of grasshoppers and 4 g per m² of frogs. Describe how to construct the pyramid using a scale of 1 mm = 4 g.

  1. Grass: 400 ÷ 4 = a bar 100 mm long, at the bottom.
  2. Grasshoppers: 40 ÷ 4 = a bar 10 mm long, above the grass.
  3. Frogs: 4 ÷ 4 = a bar 1 mm long, at the top.

Answer: Three centred bars of 100 mm, 10 mm and 1 mm, with grass at the bottom and frogs at the top.
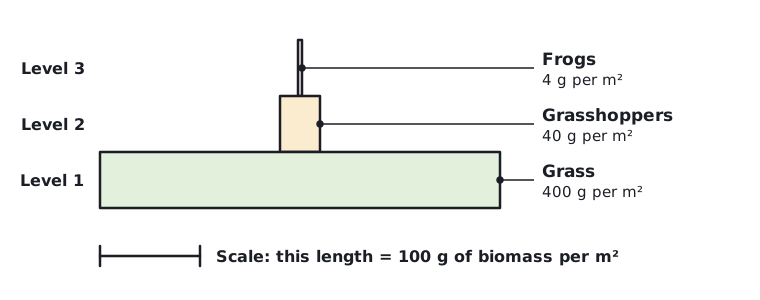
Pyramid of biomass drawn to scale from the worked example: a wide bar for grass (400 g per m²) at level 1, a much narrower bar for grasshoppers (40 g per m²) at level 2 and a very thin bar for frogs (4 g per m²) at level 3, with a scale bar showing 100 g per m². (opens full size in a new tab)
The pyramid from the worked example, drawn to scale. Each bar is about 10% of the one below it.

Written and checked against the AQA GCSE Biology (8461) specification · Updated October 2026

Frequently asked questions

Why is energy lost between trophic levels?

Energy is lost between trophic levels because biomass is lost: only about 10% of the biomass passes to the next level. Some ingested material is egested as faeces. Some absorbed material is lost as waste, such as carbon dioxide and water from respiration and water and urea in urine. Large amounts of glucose are also used in respiration.

What is a pyramid of biomass?

A pyramid of biomass is a diagram that shows the relative amount of biomass at each trophic level of a food chain, with the producers at the bottom. Each bar is narrower than the one below, because biomass decreases at each higher trophic level. The length of each bar is drawn to scale, proportional to the biomass of that level.

Why are food chains short?

Food chains are short because so much biomass is lost at each step. Only about 10% of the biomass at one trophic level is transferred to the level above, as the rest is egested, lost as waste or used in respiration. So less biomass is available at each higher level, and fewer organisms can be supported.

All 4 questions on Trophic levels in an ecosystem