
Biological drawings and measuring specimensSpec S4
In short
A biological drawing must be large, with clear, unbroken pencil lines, no shading or colour, and ruled label lines that touch the feature without arrowheads. Measure sizes in millimetres with a ruler. Magnification equals image size divided by actual size, both in the same unit, and has no unit; it is written with a × sign, such as ×3.
You may be asked to draw a specimen in front of you (a flower, seed or leaf, often seen through a hand lens) or a photograph of one, then add labels and calculate the magnification or the actual size.
Drawing rules
- Use a sharp pencil to give fine lines that are clear and unbroken.
- Make the drawing large, using most of the space provided.
- Show all the features you can see in the specimen, in the correct proportions, and nothing you cannot see.
- Use no shading and no colour.
- Draw label lines with a ruler. Each line must touch the feature it labels. Do not use arrowheads, and do not let label lines cross.
- Write labels outside the drawing, and add a title.
| Feature | Badly drawn | Well drawn |
|---|---|---|
| Outline | sketchy, broken or doubled lines | one clear, continuous line |
| Size | small, in a corner of the box | fills most of the space |
| Detail | shading, colour or features copied from a textbook | only the features seen, no shading |
| Labels | freehand lines with arrowheads that stop short | ruled lines that touch the feature |
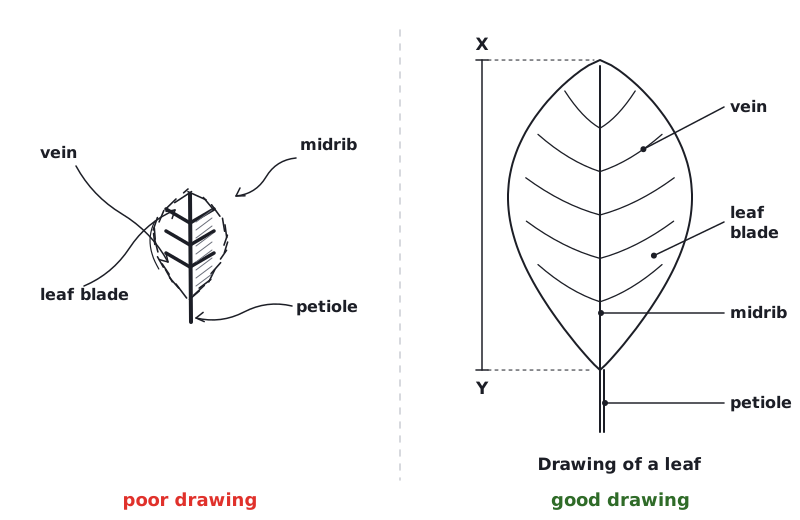 (opens full size in a new tab)
Measuring and magnification
Measure with a ruler in millimetres. To compare a drawing with a specimen or photograph, measure the same feature on both, for example the length along a line drawn between two marked points.
Here the image is your drawing or the photograph. Rearranged: actual size = image size ÷ magnification. Both sizes must be in the same unit. Magnification has no unit and is written with a × sign, for example ×3.
Magnification of a drawing
The actual length of a leaf, measured with a ruler, is 45 mm. In a student's drawing the leaf is 135 mm long. Calculate the magnification of the drawing.
- magnification = image size ÷ actual size
- = 135 mm ÷ 45 mm
- = 3
Answer: ×3
Actual size from a photograph
A photograph of a seed has a magnification of ×4. The seed is 52 mm long on the photograph. Calculate the actual length of the seed.
- actual size = image size ÷ magnification
- = 52 mm ÷ 4
- = 13 mm
Answer: 13 mm
Supplement (what this means)
Supplement: only for the Extended papers (2 and 4). Core students can skip it. What the labels meanTo convert between millimetres and micrometres: 1 mm = 1000 µm. Multiply mm by 1000 to get µm, and divide µm by 1000 to get mm. For example, a cell that is 30 mm long in an image magnified ×600 is 30 ÷ 600 = 0.05 mm = 50 µm long.
Show your measurement, the formula and the working. If the answer has many decimal places, round it sensibly, for example ×2.5 rather than ×2.4615.
Written and checked against the Cambridge IGCSE Biology (0610) specification · Updated October 2026