
The sigmoid population growth curveSpec 19.4.5, 19.4.6, 19.4.7
In short
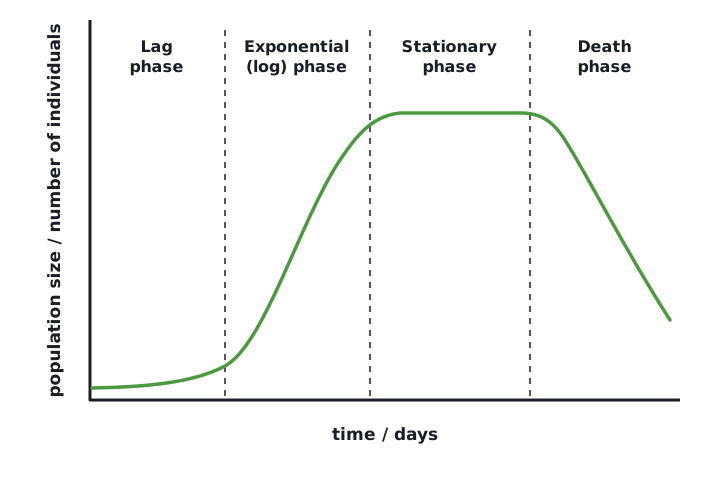
A sigmoid curve is the S-shaped growth curve of a population in an environment with limited resources. It has four phases: a lag phase of slow growth, an exponential phase of rapid growth, a stationary phase where limiting factors make birth rate equal death rate, and a death phase where the death rate is higher and the population falls.
When a small population enters an environment with limited resources, its growth follows an S-shaped curve called the sigmoid curve. It has four phases.
| Phase | What the graph shows |
|---|---|
| Lag phase | Slow growth at the start, with few individuals |
| Exponential (log) phase | Rapid growth, with the curve getting steeper |
| Stationary phase | No overall growth; the curve levels off and the population stays roughly constant |
| Death phase | The population falls |
 (opens full size in a new tab)
Supplement (what this means)
Supplement: only for the Extended papers (2 and 4). Core students can skip it. What the labels meanExplaining the phases
Supplement (what this means)
Supplement: only for the Extended papers (2 and 4). Core students can skip it. What the labels mean| Phase | Explanation |
|---|---|
| Lag phase | There are few individuals to reproduce, and the organisms are adjusting to the environment. The birth rate is low, so growth is slow. |
| Exponential (log) phase | Food and space are plentiful, and there is little competition, predation or disease. The birth rate is much higher than the death rate, and more individuals reproduce, so growth speeds up. |
| Stationary phase | Limiting factors such as food supply, space and the build-up of waste restrict growth. Birth rate equals death rate, so the population stays constant. |
| Death phase | Resources run out or waste and disease build up. The death rate is higher than the birth rate, so the population falls. |
When describing a graph, name the phase, quote figures from the axes with units, and say whether the population is rising, constant or falling.
Supplement (what this means)
Supplement: only for the Extended papers (2 and 4). Core students can skip it. What the labels meanIn the stationary phase, organisms are still being born and are still dying. The population is constant because the birth rate equals the death rate. When explaining any phase, link it to a limiting factor.
Quick check
Define a population.
Show answer
A group of organisms of one species, living in the same area, at the same time.
Define a community.
Show answer
All of the populations of different species in an ecosystem.
State the four factors that affect the rate of population growth.
Show answer
Food supply, competition, predation and disease.
Name the four phases of the sigmoid growth curve in order.
Show answer
Lag, exponential (log), stationary and death.
Supplement Why does a population level off in the stationary phase?
Show answer
Limiting factors mean the birth rate equals the death rate.
Written and checked against the Cambridge IGCSE Biology (0610) specification · Updated October 2026