
Genetic diagrams, Punnett squares and pedigreesSpec 17.4.10, 17.4.11, 17.4.12
In short
A monohybrid cross shows the inheritance of one characteristic controlled by a single gene, using a genetic diagram or Punnett square of the parents' gametes. Crossing two heterozygous parents gives a 3 : 1 phenotypic ratio, and heterozygous crossed with homozygous recessive gives 1 : 1. Pedigree diagrams trace a characteristic through a family to show which allele is dominant.
A monohybrid cross looks at the inheritance of one characteristic controlled by a single gene. You show the result using a genetic diagram or a Punnett square, which lists the possible gametes and the genotypes they can make.
- Choose letters for the alleles: a capital letter for the dominant allele and the same letter in lower case for the recessive allele.
- Write the genotypes of the parents.
- Write the gametes each parent can make. Each gamete has only one allele.
- Put the gametes along the top and side of a Punnett square and fill in the boxes to show the possible offspring genotypes.
- Write the phenotype for each genotype and work out the ratio.
Two heterozygous parents (3 : 1)
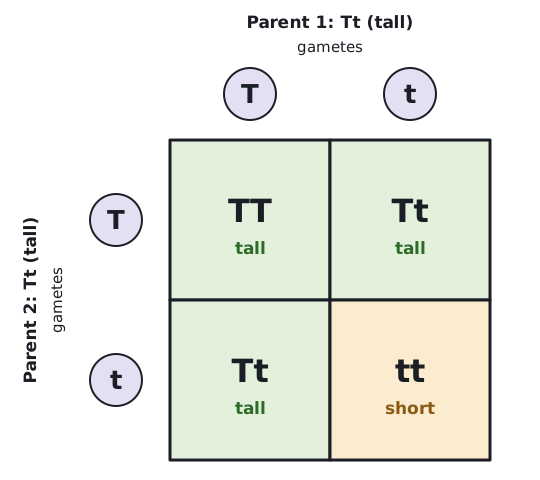
Tall (T) is dominant to short (t) in pea plants. Two heterozygous tall plants are crossed. Show the possible offspring and the phenotypic ratio.
- Parents: Tt × Tt.
- Gametes: T or t from each parent.
- Punnett square boxes: TT, Tt, Tt, tt.
- TT and Tt are tall. tt is short.
Answer: Genotypes 1 TT : 2 Tt : 1 tt. Phenotypes 3 tall : 1 short.
 (opens full size in a new tab)
Heterozygous × homozygous recessive (1 : 1)
Black fur (B) is dominant to brown fur (b) in guinea pigs. A heterozygous black guinea pig is crossed with a brown one. Show the possible offspring and the phenotypic ratio.
- Parents: Bb × bb.
- Gametes: B or b from the first parent; only b from the second.
- Punnett square boxes: Bb, Bb, bb, bb.
- Bb is black. bb is brown.
Answer: Genotypes 1 Bb : 1 bb. Phenotypes 1 black : 1 brown.
The ratios you need are 3 : 1 and 1 : 1. Circle the gametes, show every Punnett box, and write the phenotype beside each genotype.
Pedigree diagrams
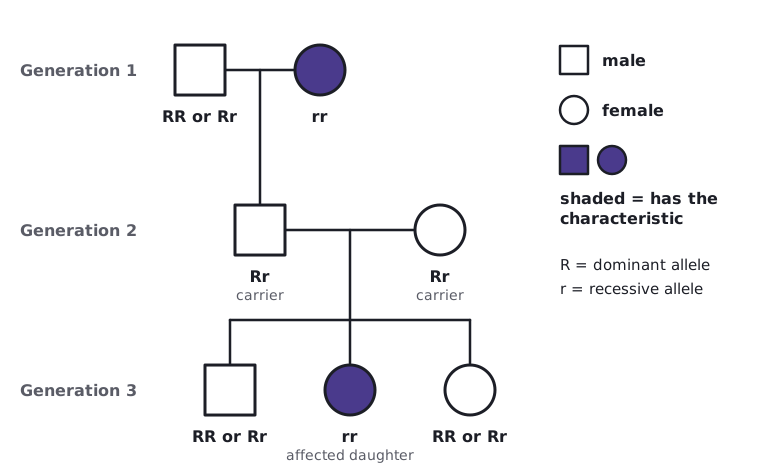
A pedigree diagram (family tree) shows how a characteristic is inherited through a family. Squares are usually males and circles are females. Shaded shapes show people with the characteristic. A horizontal line joins parents and a vertical line leads to their children.
- Two parents without a characteristic who have a child with it: the characteristic is recessive, and both parents are heterozygous (carriers).
- Two parents with a characteristic who have a child without it: the characteristic is dominant, and both parents are heterozygous.
 (opens full size in a new tab)
In a pedigree question, find two parents with the same phenotype who have a child with the other phenotype. That tells you which allele is dominant.
Written and checked against the Cambridge IGCSE Biology (0610) specification · Updated October 2026